Team
Overall status of every driver: standings by track, corner-by-corner dominance, each driver's strengths, evolution over time, and the training-goal plan connected to the AI report.
Tracks
At the very top, a list of the tracks where the team has saved sessions — it's the single selector for everything else in this tab (standings, dominance, sectors, strengths and evolution). Each row shows how many sessions that track has and who currently leads it, with their time.
Tap a track to pick it. If your team uses categories, a dropdown at the top right ("Category: All") lets you filter everything by a specific category, or see the whole team mixed together.

Selected track summary
Four cards with the overall status, two for the whole account and two for the track you picked above:
- Team sessions — this month: how many were uploaded this month, with the comparison arrow against last month
- Activity — last 4 weeks: a GitHub-style heat map, one little square per day, more intense the more sessions there were
- Corners — [track]: you pick a driver from a dropdown and see what percentage of their passes through that track's corners landed in each tier — Optimal (within 1% of their ceiling), Solid (1-3%), Room to improve (3-6%) or Losing time (more than 6%). The "ceiling" is the average of their 3 best historical times on each corner — it's never compared against the rest of the team, each driver is measured against themselves
- Most recent fastest lap — [track]: who currently has the fastest lap there, and how much they improved or fell off compared to their previous session at that track

Sector dominance map
For every corner on the picked track, calculates who "owns" it — the driver with the lowest actual time through that corner (from entry to exit, not just minimum speed), using the average of their 3 best passes. The table shows the corner, its owner with their time, and how many seconds behind each rival is over that same stretch.

Standings
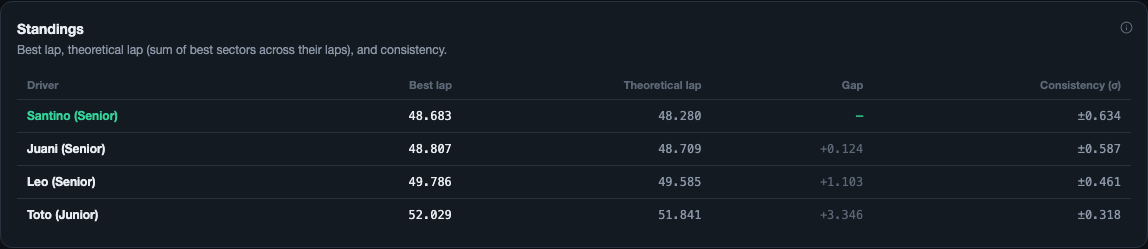
The standings table for the picked track, with four columns per driver:
| Column | What it is |
|---|---|
| Best lap | Their fastest lap among the eligible ones (warm-up/cool-down laps are dropped, anything slower than 107% of their own best lap of that session) |
| Theoretical lap | The sum of the best time achieved in each sector across ALL their eligible laps — the time "on the table" if they strung their best stretches into a single lap |
| Gap | Difference against the team's fastest driver at that track |
| Consistency (σ) | Standard deviation of their eligible laps — lower means more even lap to lap |
Sectors
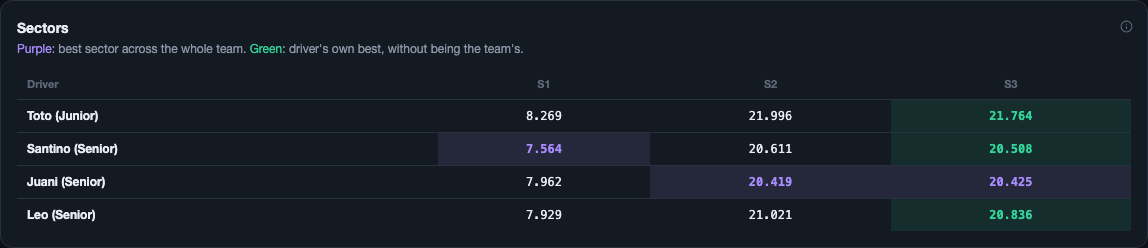
The same sector cuts as Standings, but broken down per driver — so you see not just who's fastest overall, but in which specific part of the track. The cuts are defined once (on the team's overall fastest lap, or the sectors calibrated by hand in Stats if they exist), so everyone is compared against the same stretches.
- Purple — best time in that sector across the whole team
- Green — their own best-ever time in that sector, without being the team's
- White — everything else
Corner execution
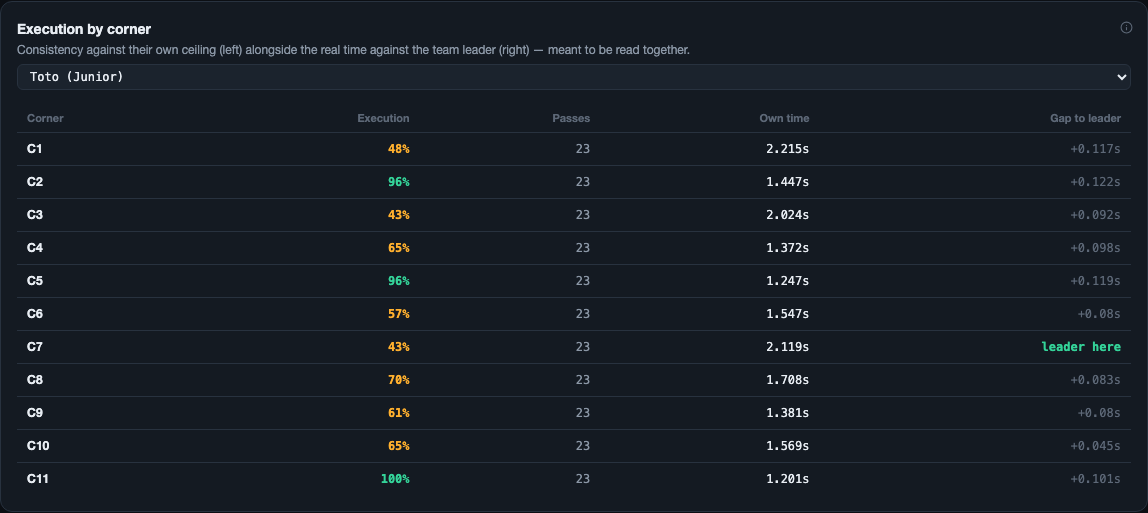
You pick a driver and see, corner by corner on the track, two things together on purpose:
- Execution — percentage of their passes that land within 3% of their own best time on that corner. It measures consistency against themselves, not against the team
- Gap to leader — how much longer they take compared to the fastest driver there (this one IS comparative, same as the dominance map)
The two columns are meant to be read together, because a driver can have lower "execution" (they struggle to repeat their own time) and still take less time than everyone else — the gap to leader makes that clear.
Fastest-lap evolution
A line chart with one point per session — the fastest eligible lap of that day, for each driver — so you see the whole team's progression at a track over time. A range selector (All / 12 / 6 / 3 months) filters by session date.

Training goals per driver
Below everything above, one collapsible row per driver with saved sessions. Collapsed, each row already gives you the overall status at a glance:
- Driver's name and how many sessions they have logged
- Last session — date and track
- Best time on record, in green
- Trend — a ▼ arrow (improved) or ▲ (got worse) comparing the last session against the previous one, only if both were at the same track (otherwise it doesn't show, to avoid comparing times from different tracks)
- Goals badge — "N goals pending" in yellow, or "goals up to date" in green if none are pending

Tap any row to expand it and see that driver's full training plan.
Add a goal
Inside a driver's expanded row, the "+ New goal" button opens a form with:
- Goal — the title, required (e.g. "improve braking in slow corners")
- Detail — optional free text, to go into more depth
- Date — an optional date picker, for when you expect to see it resolved
Confirm with Save, or cancel to discard the form without saving anything.

Change status
Each goal already logged shows up as a card with its title, detail (if it has one) and due date ("due [date]", if you set one). Next to it there's a dropdown with the three possible states:
| Status | Color |
|---|---|
| Pending | Gray — not started yet |
| In progress | Yellow — actively being worked on |
| Achieved | Green — goal met |
Changing the status in the dropdown updates instantly, no separate save needed.
Delete a goal
Each goal card has a ✕ next to the status dropdown — tap it and it's deleted right away, with no confirmation screen (unlike deleting a session under Drivers, which does ask for confirmation).
How this connects to the AI report
A driver's "In progress" goals are automatically pulled in when you generate their coaching report under Analysis → AI report — no need to repeat them by hand in the note. That keeps the report consistent with the driver's actual training plan, session after session.