Corners
Its own tab, dedicated to going through the track corner by corner with detail the compared trace can't show all at once.
What it is and what it's for
The Analysis tab shows you the whole lap in one go. Corners does the opposite: it lets you stop at one corner at a time and look closely at the braking point, the apex and the exit — with quick navigation between corners without losing the context of the others.
It uses the same reference and compared lap selectors as Analysis, and shares the track's calibrated corner profile — if you recalibrated a corner by hand in Analysis, it shows up here too.
How the screen is organized
It's split into two columns:
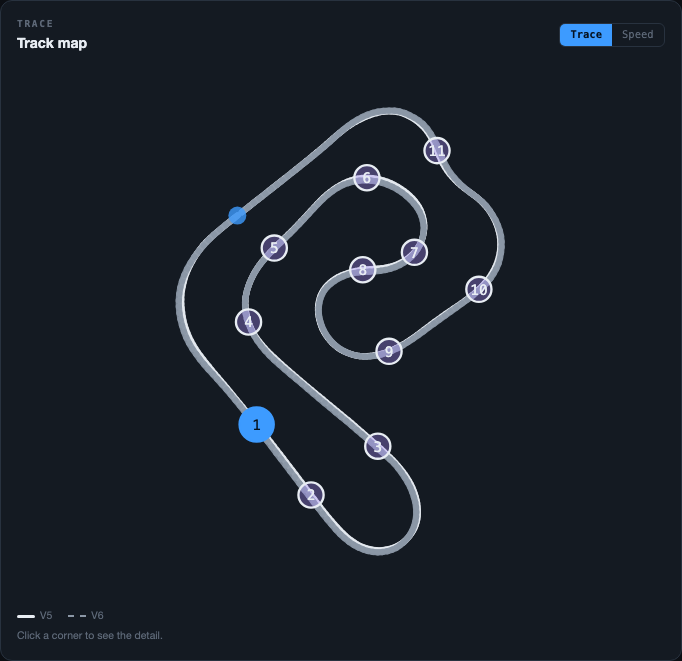
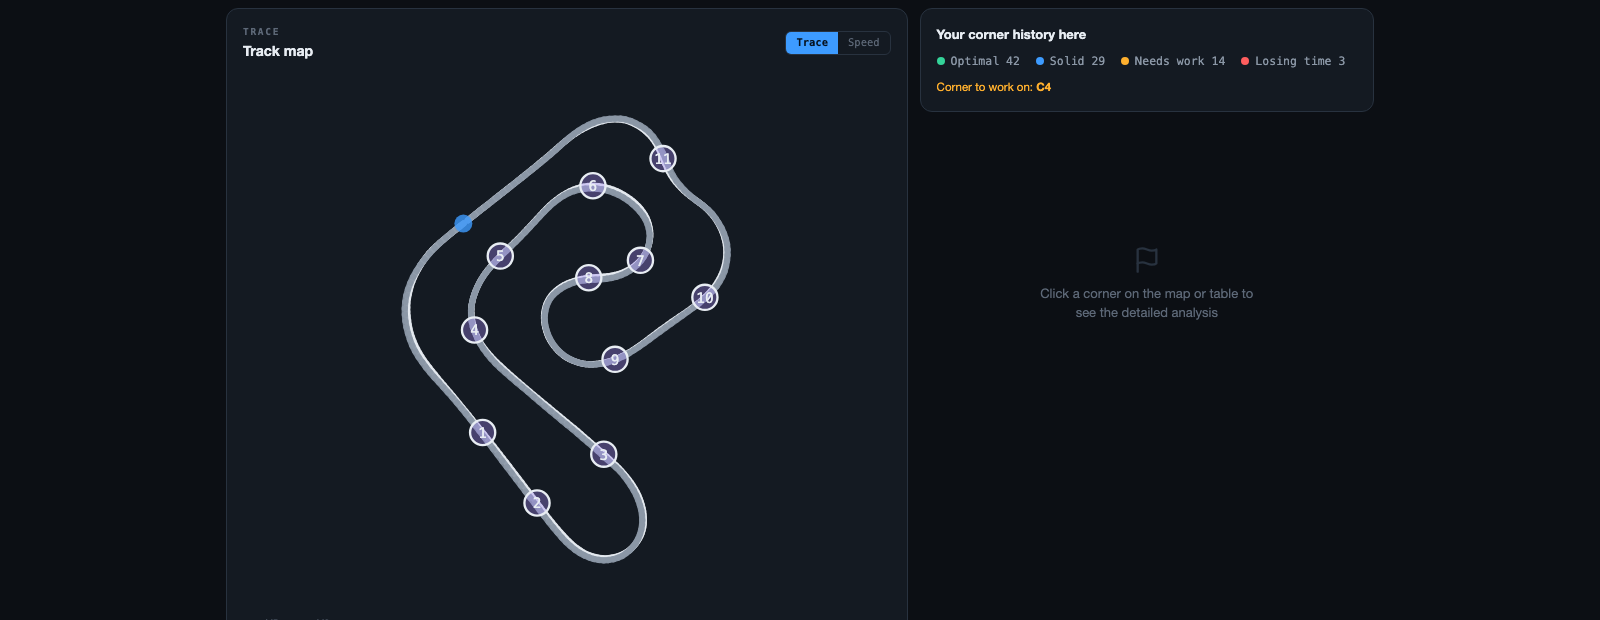
- Left column — the track map with each corner numbered and clickable, and below it a compact table with every corner at a glance
- Right column — the full detail for whichever corner you have selected
Navigate between corners
- Click a corner number on the map
- Click a row in the table
- ← → arrow keys on the keyboard, to go through every corner on the track without letting go of the mouse
Corner summary table
Lists every corner with:
| Column | What it shows |
|---|---|
| Corner | Corner numbering (C1, C2, C3…) |
| Apex | Track meter where the point of maximum curvature is |
| Ref / Cmp | Each lap's apex speed |
| Diff. | Speed difference between the two — highlighted in red or green depending on who won that corner |
| Lat. | Peak lateral acceleration recorded in the corner |
Selected corner detail
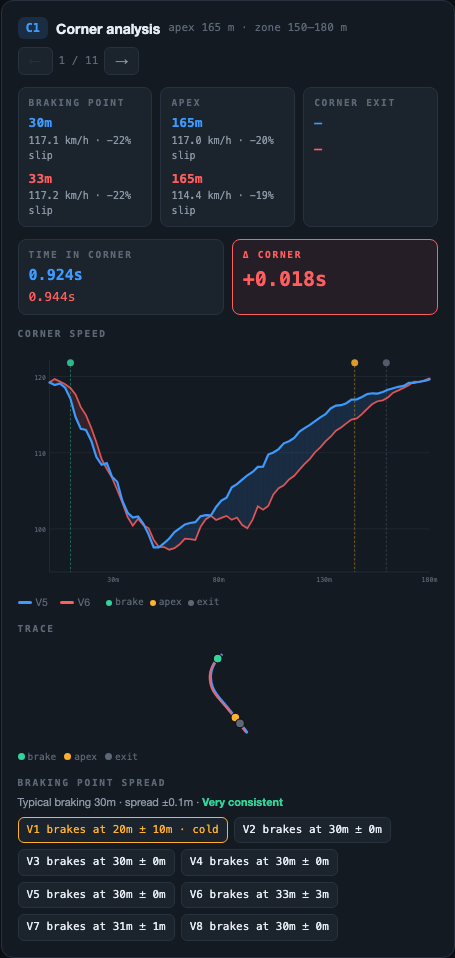
When you pick a corner, the right-hand panel analyzes three exact points of that corner for both laps:
- Braking point — where each driver started braking
- Apex — the slowest point of the corner
- Corner exit — where they got back on the throttle
At each of those three points you see distance, speed and the Slip channel for both laps, plus the total time each driver took to get through that specific corner and the difference between the two just for that stretch.
Braking consistency for that corner
Unlike the general braking consistency panel (which summarizes the whole lap), here you see the consistency calculated specifically for this corner, against every lap in the session — with the same color scheme: green (consistent), yellow (variable), red (erratic).
Corner mini map
A GPS map zoomed into just that corner, showing the actual line each driver took — useful for seeing whether the time difference comes from a different line (a wider entry, cutting the apex more) and not just from speed.